An Interrupted Time Series Analysis of Voter Turnout in Iowa and Delaware
Introduction
In this project for my Data Visualization class at Johns Hopkins University, using the Correlates of State Policy dataset from Michigan State University,1 I conduct an interrupted time series (ITS) analysis on two states to evaluate the impacts of their policy changes in 1991-1992 (Iowa) and 1995-1996 (Delaware) on voter turnout.2 These states serve as ideal candidates for ITS, as they only had one period of policy change from 1980-2010. The policy changes are detailed in the table below. Generally, both of Iowa’s policies would be expected to lead to increased turnout, while one of Delaware’s two policies would be expected to depress turnout instead.
Table 1: Policy Changes in Iowa and Delaware
| State | Year | Change | Expected Effect |
|---|---|---|---|
| Iowa | 1991 | Added absentee and early voting | Increased turnout |
| Iowa | 1992 | Added registration while applying for or renewing driver’s license | Increased turnout |
| Delaware | 1995 | Added registration while applying for or renewing driver’s license | Increased turnout |
| Delaware | 1996 | Requires some kind of ID for voting | Decreased turnout |
I use a basic interrupted time series (ITS) model to estimate the effects of these policy changes on each state separately. For both Iowa and Delaware, the model takes the form:

where:
- Yt is the voting-eligible population (VEP) voting rate,
- β0 is the baseline VEP voting rate,
- timet captures the linear time trend,
- treatmentt is a binary indicator equal to 1 if t ≥ policy year, and 0 otherwise,
- time_postt represents the number of years since the policy was implemented and serves as an interaction between treatment and time (0 before treatment),
- prez_election_yeart is a control for presidential election years (1 for presidential years, 0 otherwise),
- and εt is the error term.
In each case, treatments show an initial negative effect, though Delaware’s is likely more substantial due to their implementation of a voter ID law in 1996. After the initial decline, both state experience an upward trend in voter rate, though Delaware’s is larger than Iowa’s. In addition, only Delaware’s treatment and time trends are statistically significant. This could be partially explained by residents of Delaware adjusting to the new ID laws and being able to register at higher rates over time, in addition to the secondary positive effect of the motor license registration law, though more exploration would be needed to determine an exact cause.
Table 2: Interrupted Time Series Regression Results for Iowa and Delaware
| Iowa | Delaware | |
|---|---|---|
| + p < 0.1, * p < 0.05, ** p < 0.01, *** p < 0.001 | ||
| (Intercept) | 48.102*** | 38.882*** |
| (2.650) | (2.330) | |
| time | −0.190 | −0.117 |
| (0.353) | (0.229) | |
| treatment | −6.264 | −24.050** |
| (4.357) | (5.937) | |
| time_post | 0.482 | 1.206** |
| (0.384) | (0.320) | |
| prez_election_year | 16.778*** | 19.096*** |
| (1.491) | (1.503) | |
| Num.Obs. | 16 | 16 |
| R2 | 0.924 | 0.942 |
| R2 Adj. | 0.897 | 0.921 |
| Log.Lik. | −36.768 | −36.920 |
| F | 33.568 | 45.000 |
| RMSE | 2.41 | 2.43 |
Visual Description and Trend
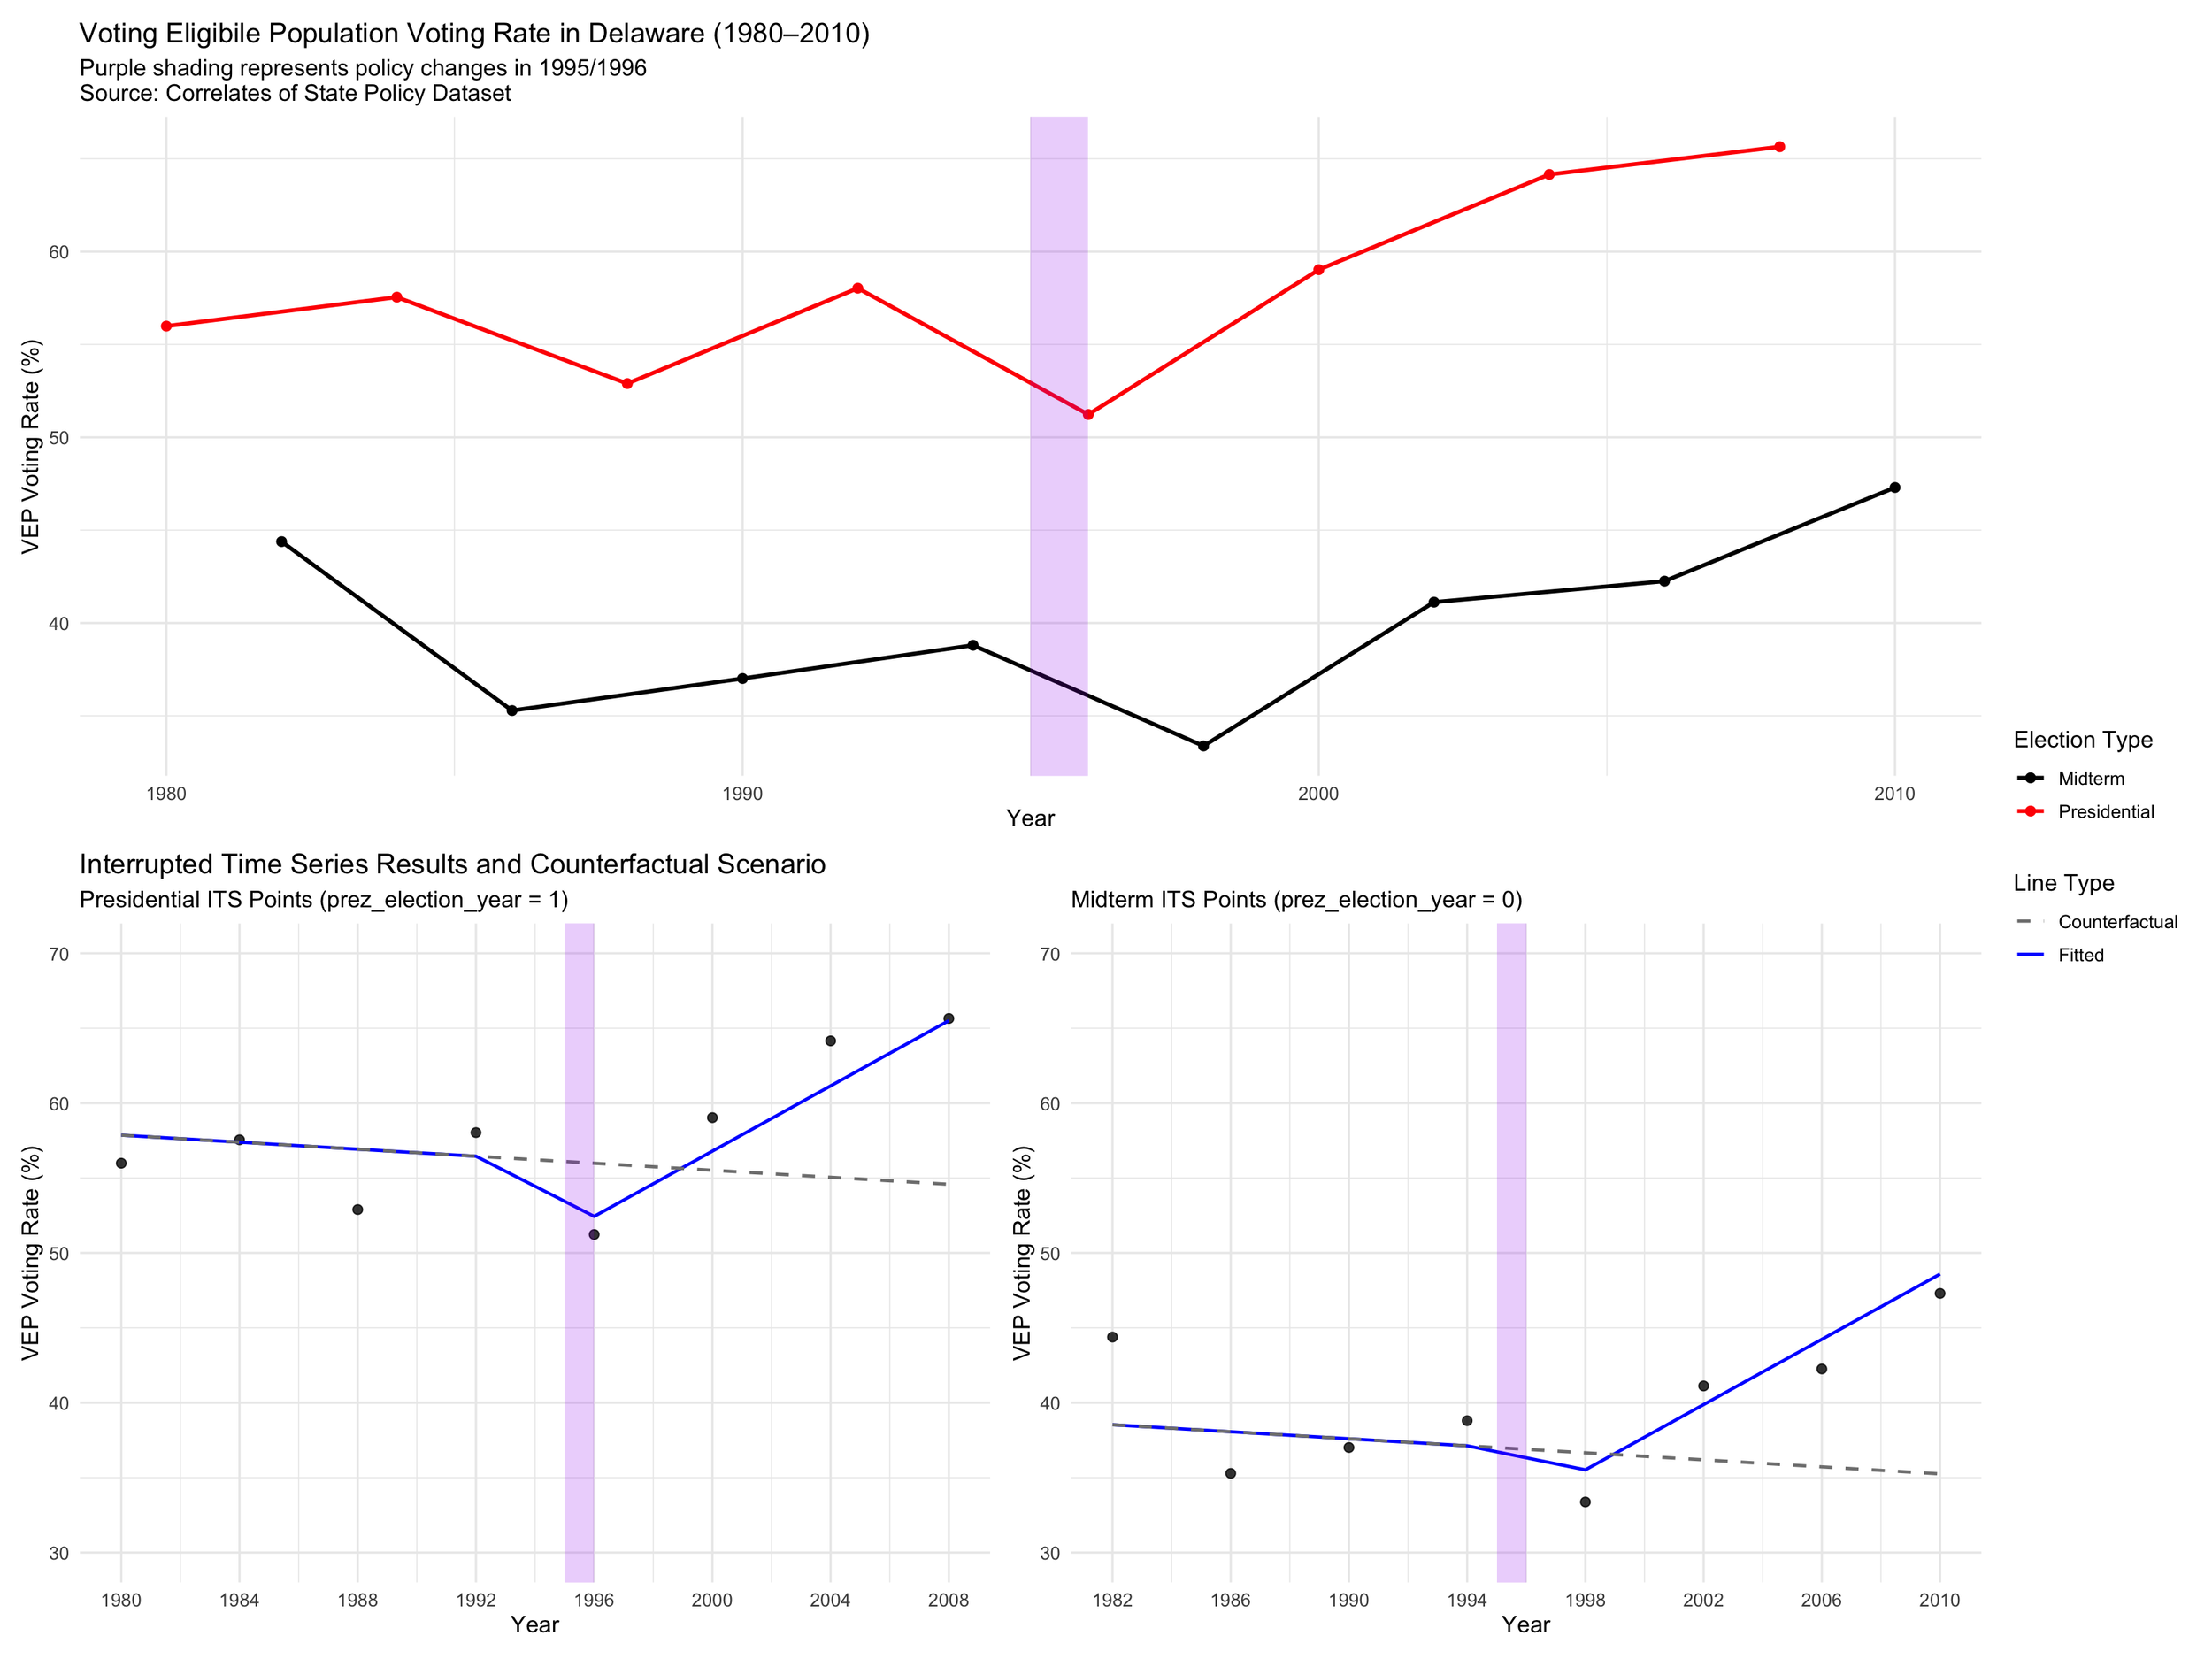
As only Delaware had statistically significant results, I proceed with highlighting Delaware’s policy changes via visualization, using three charts. The top chart shows a time-series of Delaware’s midterm and presidential election voter turnout over time, with purple highlighting indicating the period of policy changes. In both election types, there is a general increase in voter turnout after an initial decline in the years following the policy changes.
Below that, I plotted the results of the ITS for both election types, while including a dashed counterfactual line to estimate the voter turnout without a policy change. The distance of the fitted ITS model from the counterfactual line generally indicates a higher effect of whatever treatment has been applied.3 In this case, the ITS model again indicates that there is an initial voting rate decline in the 1996/1998 elections, before seeing voter turnout increases in each subsequent election.
Conclusion
For this project, I utilized an interrupted time series approach to study the effects of voting law changes in Iowa and Delaware, selected since they only change their policies one time in the 1980-2010 period. While both states exhibited similar trends, Delaware’s effects were more pronounced and was the only state whose policy changes could be considered statistically significant. Delaware saw an immediate drop-off in voter turnout, likely from their new voter ID law from 1996, before seeing increasing turnout through 2010. Future research should aim to control for other voting policy schemes to study other voting policy types and impacts, and could also consider the political makeup of the states to explain and clarify potential effects on voter turnout.
References
Footnotes
See Institute for Public Policy and Social Research, Michigan State University (2021).↩︎
Thank you to Dr. David Warren for his willingness to help me brainstorm and process this idea early on, and Dr. Holly Brasher for her support to pursue this and her feedback. This would not be as good of a project without your input. All errors are my own.↩︎
The causal effect from the treatment can be assumed if there are not other confounders to control for. In this instance, other policy changes do not take effect. Given we also see a similar trend in Iowa (though not a statistically significant one), it reasonable to assume some causal effect from this policy.↩︎